

Some key insights from the article:
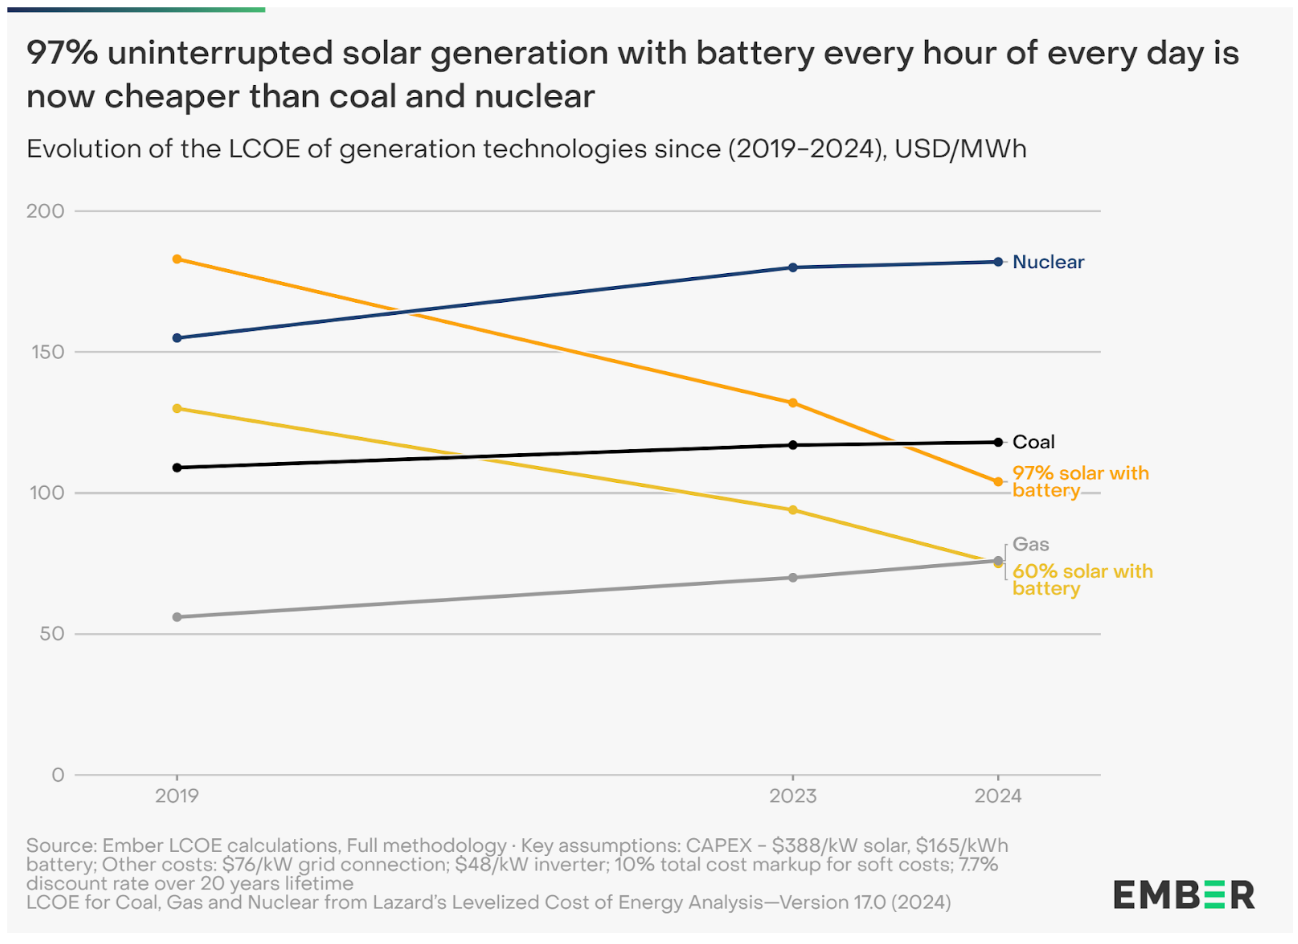
Basically, what they did was to look at how much batteries would be needed in a given area to provide constant power supply at least 97% of the time, and the calculate the costs of that solar+battery setup compared to coal and nuclear.
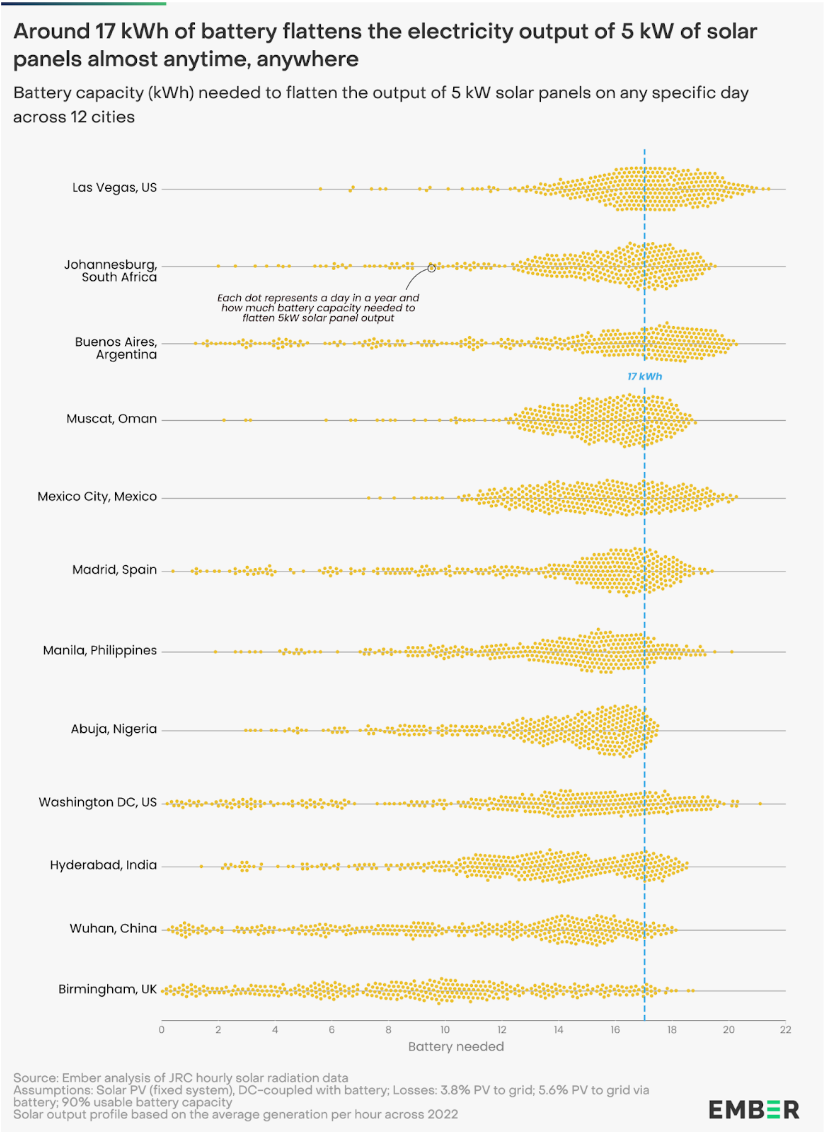
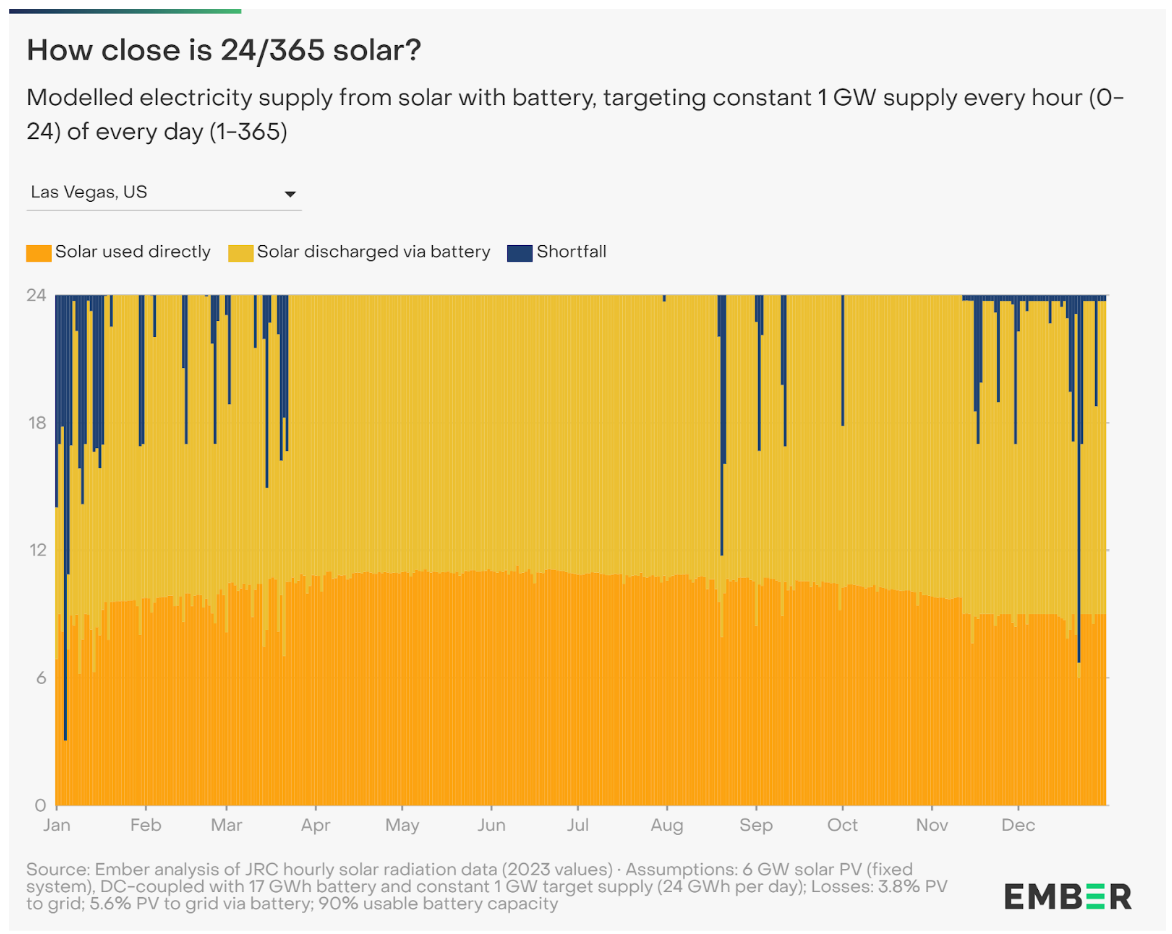
My understanding of that graph is how do you flatten peak energy demands, Birmingham is flat and throughout the year because you have some parts of the year where you need very little battery capacity and other parts where you need a lot. Las Vegas basically always needs a lot because of how hot it gets they end up with huge amounts of peak energy usage